
The worst municipality in South Africa


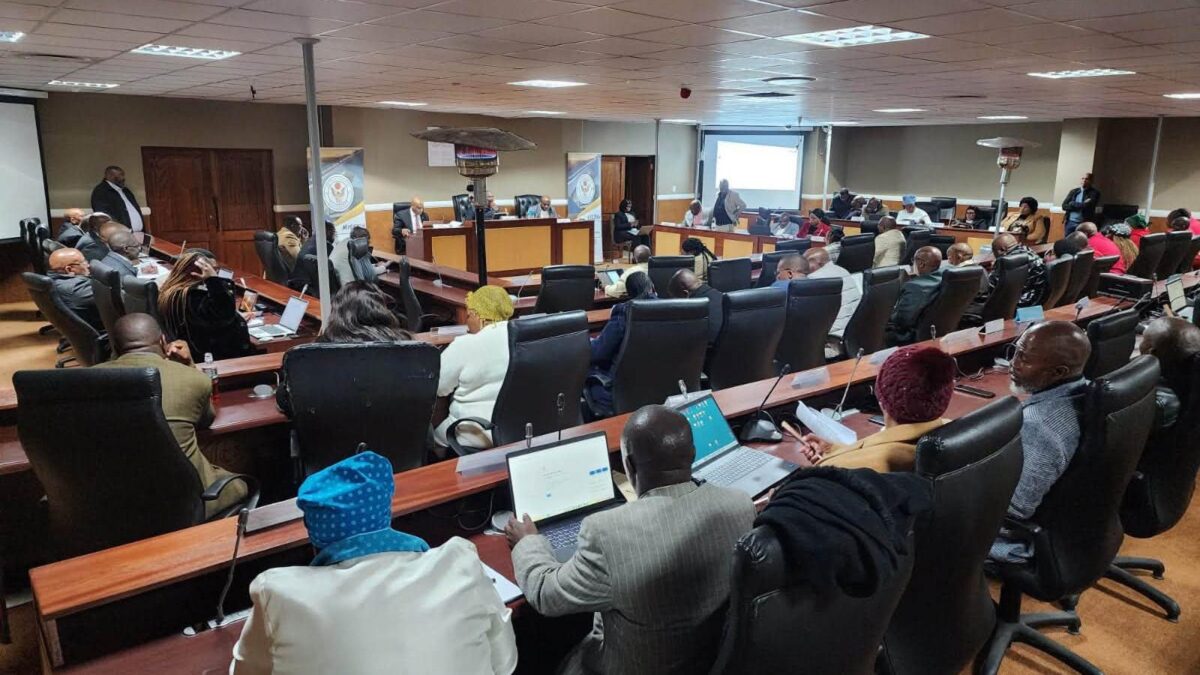
Maluti-a-Phofung ranked last in the country among the 50 municipalities assessed in the FW de Klerk Foundation’s Local Government Report Card 2026.
Maluti-a-Phofung is a local municipality in the Thabo Mofutsanyane District of the Free State and covers 4,338 square kilometres.
The municipality includes Phuthaditjhaba, Harrismith, and Kestell, and houses most of the former QwaQwa homeland.
The Maluti-a-Phofung municipality, which is close to the Drakensberg mountains, relies mainly on agriculture and tourism for its economy.
The municipality has experienced a long-term breakdown in municipal administration and basic service delivery.
Large parts of Qwaqwa and surrounding settlements endure prolonged water outages, often stretching for weeks or months.
The situation has deteriorated to the point that residents are forced to rely on water tankers or natural water sources.
The municipal water entity, MAP Water, has been in financial distress, leading to clashes with trade unions.
Maluti-a-Phofung has historically been one of Eskom’s largest municipal debtors, owing billions of rands.
This has previously resulted in court battles, bank account attachments, and localised grid load-reduction measures by Eskom.
Frequent unplanned power outages caused by overloaded transformers, lack of maintenance, and copper theft regularly paralyse local businesses and households.
Failing wastewater treatment infrastructure also regularly results in raw sewage overflows in residential areas and rivers.
To make matters worse, the municipal council has seen frequent shifts in power, unstable coalitions, and political infighting.
Local Government Report Card 2026 rankings
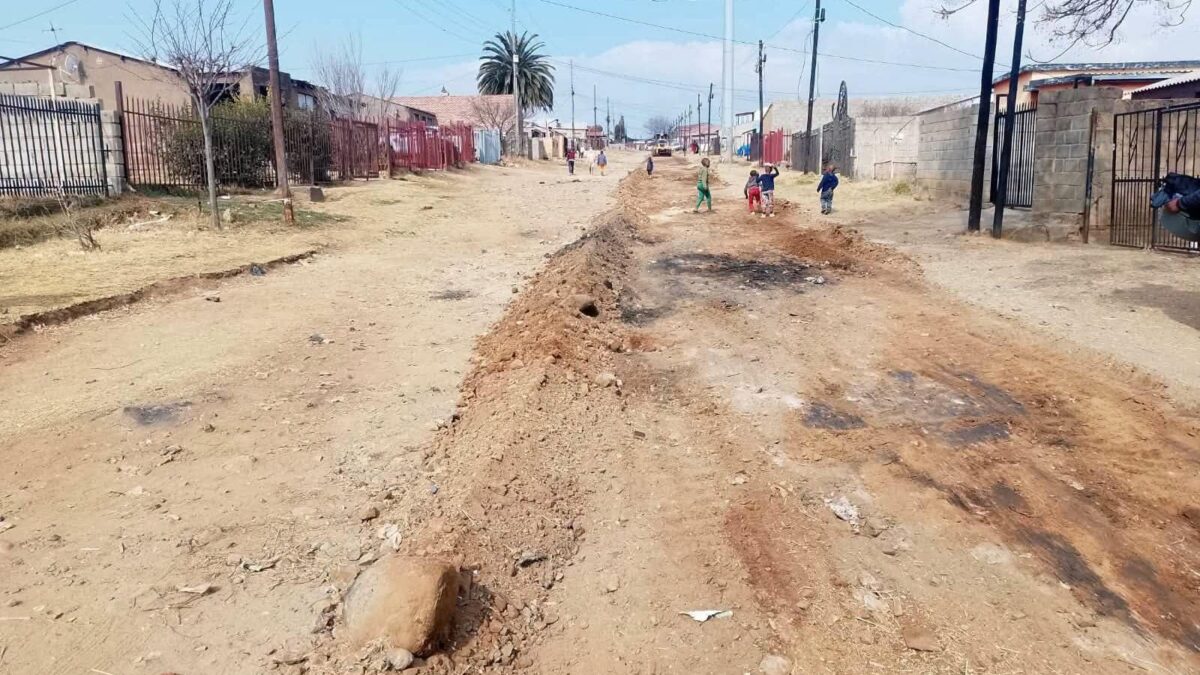
The Maluti-a-Phofung municipality was ranked at the bottom of the FW de Klerk Foundation’s Local Government Report Card 2026, which was released this week.
This report card is an independent, non-partisan assessment of municipal performance and constitutional accountability across South Africa.
The assessment applies 100 published tests across five weighted pillars:
- Services and infrastructure
- Financial management; governance
- Leadership and administrative coherence
- Integrity, accountability and transparency
- Constitutional advancement and inclusion
Each municipality receives a score out of 100, an automatic grade, and a separate trajectory finding indicating whether it is improving, stable, or deteriorating.
The report examined all eight metropolitan municipalities and a sample of 42 local municipalities across South Africa’s nine provinces.
Swartland Local Municipality ranked first with 90.0, while Maluti-a-Phofung recorded the lowest score at 24.0.
Roy Jankielsohn, the DA’s Free State Leader, said that the report showed that municipalities in the Free State are failing to deliver basic services.
“This is not just a report card, it is a reflection of the daily reality facing residents who endure collapsing roads, unreliable water, and electricity outages,” he said.
“Residents face failing sanitation systems and municipalities that are unable to create an environment for economic growth and job creation.”
Best and worst municipalities in South Africa
| Rank | Municipality | Province | Score | Grade | Direction |
| 1 | Swartland Local Municipality | Western Cape | 90.0 | A | Improving |
| 2 | George Local Municipality | Western Cape | 87.5 | A | Improving |
| 3 | Stellenbosch Local Municipality | Western Cape | 86.0 | A | Stable |
| 4 | Midvaal Local Municipality | Gauteng | 84.5 | A- | Stable |
| 5 | City of uMhlathuze Local Municipality | KwaZulu-Natal | 83.0 | A- | Deteriorating |
| 6 | Kouga Local Municipality | Eastern Cape | 82.5 | A- | Stable |
| 7 | uMngeni Local Municipality | KwaZulu-Natal | 81.5 | A- | Improving |
| 8 | City of Cape Town Metropolitan Municipality | Western Cape | 81.0 | A- | Stable |
| 9 | Greater Tzaneen Local Municipality | Limpopo | 75.5 | B+ | Improving |
| 10 | Polokwane Local Municipality | Limpopo | 72.0 | B | Improving |
| 10 | Steve Tshwete Local Municipality | Mpumalanga | 72.0 | B | Deteriorating |
| 12 | Mbhashe Local Municipality | Eastern Cape | 71.0 | B | Improving |
| 13 | uMhlabuyalingana Local Municipality | KwaZulu-Natal | 68.0 | B- | Improving |
| 14 | Ray Nkonyeni Local Municipality | KwaZulu-Natal | 67.5 | B- | Stable |
| 15 | Matatiele Local Municipality | Eastern Cape | 65.8 | B- | Stable |
| 16 | Fetakgomo Tubatse Local Municipality | Limpopo | 64.3 | C+ | Improving |
| 17 | King Sabata Dalindyebo Local Municipality | Eastern Cape | 59.5 | C | Improving |
| 18 | Mogale City Local Municipality | Gauteng | 58.5 | C | Stable |
| 18 | Nama Khoi Local Municipality | Northern Cape | 58.5 | C | Improving |
| 20 | Buffalo City Metropolitan Municipality | Eastern Cape | 58.0 | C | Deteriorating |
| 21 | City of Mbombela Local Municipality | Mpumalanga | 57.0 | C | Deteriorating |
| 21 | Dawid Kruiper Local Municipality | Northern Cape | 57.0 | C | Improving |
| 21 | JB Marks Local Municipality | North West | 57.0 | C | Improving |
| 24 | City of Ekurhuleni Metropolitan Municipality | Gauteng | 56.0 | C | Deteriorating |
| 25 | Bushbuckridge Local Municipality | Mpumalanga | 55.5 | C | Stable |
| 25 | Nelson Mandela Bay Metropolitan Municipality | Eastern Cape | 55.5 | C | Stable |
| 27 | Rustenburg Local Municipality | North West | 55.0 | C | Stable |
| 28 | Gamagara Local Municipality | Northern Cape | 53.0 | C- | Improving |
| 29 | City of Tshwane Metropolitan Municipality | Gauteng | 52.5 | C- | Improving |
| 29 | Musina Local Municipality | Limpopo | 52.5 | C- | Deteriorating |
| 29 | eThekwini Metropolitan Municipality | KwaZulu-Natal | 52.5 | C- | Stable |
| 32 | Mahikeng Local Municipality | North West | 52.0 | C- | Stable |
| 33 | Lephalale Local Municipality | Limpopo | 51.0 | C- | Deteriorating |
| 34 | Beaufort West Local Municipality | Western Cape | 50.5 | C- | Improving |
| 35 | City of Johannesburg Metropolitan Municipality | Gauteng | 49.5 | D+ | Deteriorating |
| 36 | Greater Taung Local Municipality | North West | 49.0 | D+ | Improving |
| 37 | Govan Mbeki Local Municipality | Mpumalanga | 48.5 | D+ | Stable |
| 38 | Newcastle Local Municipality | KwaZulu-Natal | 46.5 | D+ | Deteriorating |
| 39 | Dihlabeng Local Municipality | Free State | 46.0 | D+ | Improving |
| 40 | Enoch Mgijima Local Municipality | Eastern Cape | 45.5 | D+ | Stable |
| 40 | Metsimaholo Local Municipality | Free State | 45.5 | D+ | Stable |
| 42 | Mangaung Metropolitan Municipality | Free State | 43.0 | D | Deteriorating |
| 43 | Theewaterskloof Local Municipality | Western Cape | 42.0 | D | Deteriorating |
| 44 | Msunduzi Local Municipality | KwaZulu-Natal | 41.5 | D | Improving |
| 45 | Sol Plaatje Local Municipality | Northern Cape | 38.5 | D- | Deteriorating |
| 46 | Matjhabeng Local Municipality | Free State | 34.5 | F | Deteriorating |
| 47 | Emfuleni Local Municipality | Gauteng | 33.5 | F | Deteriorating |
| 48 | Makana Local Municipality | Eastern Cape | 29.5 | F | Stable at a distressed level |
| 49 | Renosterberg Local Municipality | Northern Cape | 29.0 | F | Deteriorating |
| 50 | Maluti-a-Phofung Local Municipality | Free State | 24.0 | F | Deteriorating |

 Loading ...
Unfortunately, our corruption- and theft-loving compatriots will not vote for anyone who will end this. Remember, Africa runs on corruption and theft.