South Africa has the worst port in the world
The World Bank’s Container Port Performance Index (CPPI) 2025 ranked Cape Town as the worst port in the world.
The index provides a global, data-driven assessment of container port performance based on observed vessel time in port.
Developed by the World Bank and S&P Global Market Intelligence, the CPPI has become an established benchmark for comparing port efficiency.
The index measures how long container ships spend in port, capturing the combined effects of nautical access and berth availability.
It also measures cargo-handling productivity, yard operations, and stakeholder coordination at the world’s ports.
By relying on actual vessel call data rather than self-reported indicators, the CPPI reflects how ports operate within real global shipping networks.
The World Bank’s Container Port Performance Index, therefore, provides a consistent basis for benchmarking performance.
In 2025, global port performance showed a slight deterioration compared with 2024, with longer vessel turnaround times on average.
Several ports in East and South Asia again ranked among the top performers, while some ports in Europe and North America continued recovering from earlier congestion.
Ports in Sub-Saharan Africa, often characterised by capacity constraints and import-dominated trade structures, typically recorded longer turnaround times.
The 2025 edition highlights ports’ exposure to global supply chain disruptions. Recent years have seen repeated shocks.
These shocks included pandemic-related volatility, geopolitical rerouting, and climate-related events.
These disruptions affect vessel arrival patterns, create congestion, and lengthen time spent in port. At the same time, port performance itself influences supply chain stress.
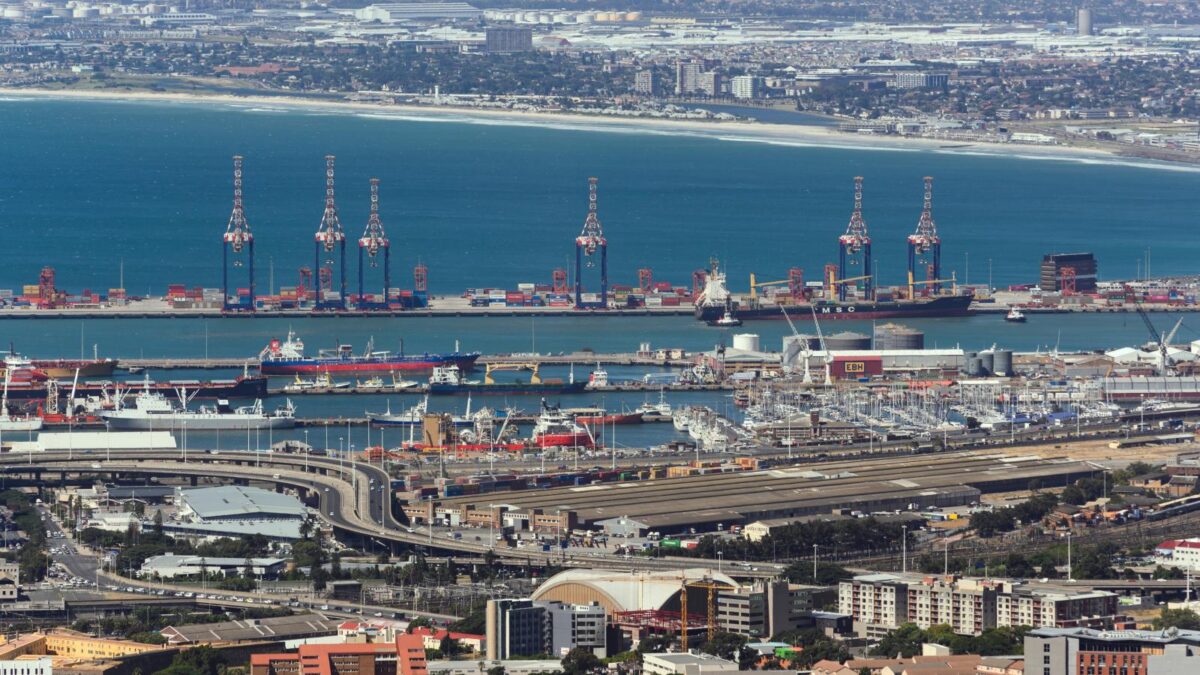
Cape Town is the worst port in the world
The World Bank’s Container Port Performance Index (CPPI) 2025 ranked Cape Town as the worst port in the world.
It stated that Cape Town illustrates how vessel turnaround times can worsen even when broader congestion indicators fluctuate.
Persistent weather-related disruption, combined with equipment reliability issues, led to high variability in ship times in port despite periods of easing supply chain stress.
This deterioration was accompanied by a decline in berth utilisation, suggesting that vessels increasingly accumulated time outside productive berth operations.
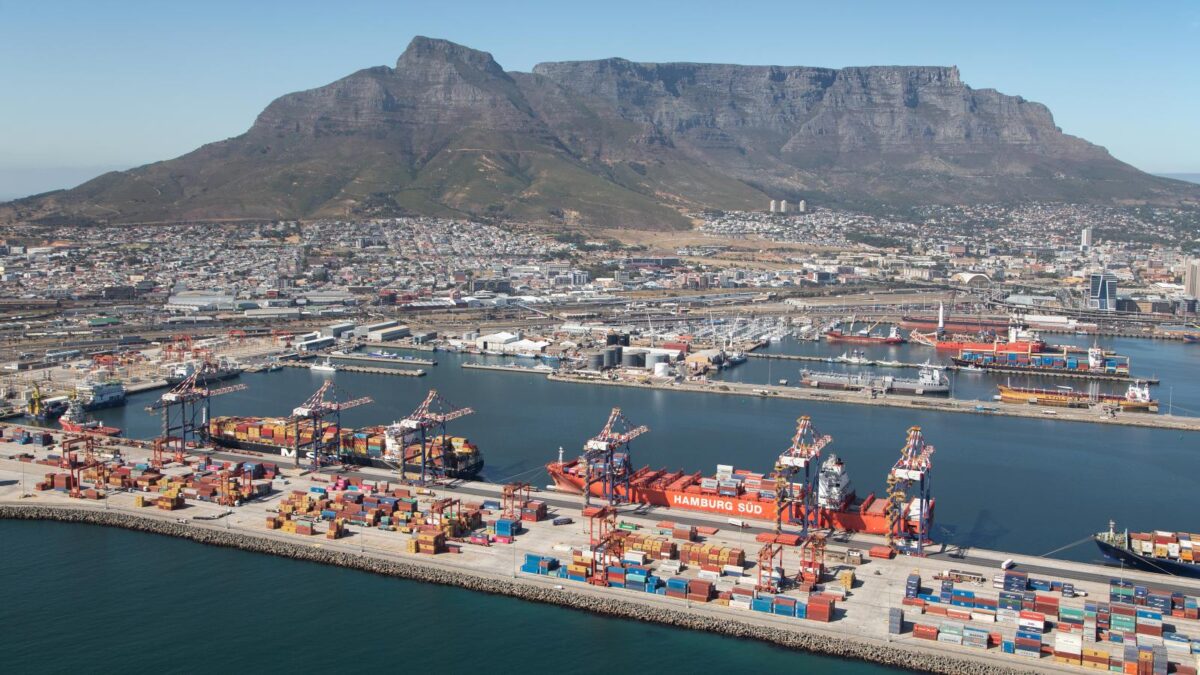
In response, Cape Town has introduced a predictive wind model developed with the Council for Scientific and Industrial Research to reduce weather-related disruptions.
It has also implemented a helicopter piloting service to improve ship access during high swells, and a digital technology platform for cargo planning.
The port’s CPPI trajectory underlines how structural exposure to external conditions can dominate performance outcomes, independent of global demand cycles.
Best and worst ports in the world
| Rank | Port | Territory | Performance Level |
| 1 | Fuzhou | China | Best |
| 2 | Dalian | China | High |
| 3 | Salalah | Oman | High |
| 4 | Mawan | China | High |
| 5 | Chiwan | China | High |
| 6 | Tanger Med | Morocco | High |
| 7 | Ningbo | China | High |
| 8 | Hamad Port | Qatar | High |
| 9 | Hong Kong | Hong Kong SAR, China | High |
| 10 | Kobe | Japan | High |
| … | … | … | … |
| 391 | Pointe-Noire | Congo, Republic of | Low |
| 392 | Genova | Italy | Low |
| 393 | Acajutla | El Salvador | Low |
| 394 | Suape | Brazil | Low |
| 395 | Kribi Deep Sea Port | Cameroon | Low |
| 396 | Mombasa | Kenya | Low |
| 397 | Rijeka | Croatia | Low |
| 398 | Durban | South Africa | Low |
| 399 | Conakry | Guinea | Low |
| 400 | Cape Town | South Africa | Worst |


These folks have destroyed this country on every entity (ANC) and their BEE must go..really nothing of substance except enriching themselves.